· 9 min read
Observability for AI Agents: Why Tracing Matters and How to Do It with Langfuse
AI agents fail in ways that infrastructure traces can't explain. Learn why production agents need semantic observability, and how to add it to a LangGraph + Next.js app with Langfuse.
Copy a command, then paste it into the command palette (Ctrl K to open).
Introduction
Deploying an AI agent means shipping a system you can't fully predict. The same user message can produce different behavior on different runs. A bad tool result at step 3 can silently corrupt steps 4 through 10. Token costs compound in loops you didn't expect. Without visibility into what's happening inside the agent, you're flying blind.
This is where observability comes in — and if you've built distributed systems before, you already know the concepts. Traces, spans, metadata: the same model applies. If you've used OpenTelemetry, Jaeger, or Datadog APM, your existing instrumentation still helps. Your OTel setup will capture the HTTP request, the database query, the response time. Your trace might look like this:
Trace: POST /api/agent/stream
  └─ HTTP span (200 OK, 2.1s)
       └─ DB span: checkpoint read (12ms)
That's useful, but it leaves the most important part opaque. The 2.1s that happened inside the agent — the LLM calls, the tool decisions, the graph node execution — is invisible. Your trace tells you the agent ran. It doesn't tell you:
- Which LLM call returned a hallucinated result?
- Why did it invoke the same tool three times?
- Which node in the graph caused the wrong branch to execute?
- How much did that one conversation cost?
Agents inherit the same observability concepts as distributed systems, but they need one layer deeper: semantic traces that capture agent reasoning, not just infrastructure spans.
Why Agents Are Uniquely Hard to Debug
Non-determinism. The same user message can produce different agent behavior on every run. You can't just "reproduce the bug" in isolation. The trace of what happened IS the bug report.
Multi-step reasoning chains. A LangGraph agent might run through 8–12 nodes before producing a response. A bad tool result at step 3 can silently corrupt everything that follows. Without visibility into each step, you're guessing where the chain broke.
Compounding costs. LLM calls in agent loops are expensive. Without per-call visibility, you only discover the runaway cost when the billing statement arrives. Knowing that one node is responsible for 80% of token usage changes where you optimize.
Real-world side effects. Agents don't just think — they act. They send emails, write to databases, call external APIs. A trace showing "tool called 4 times" versus "tool called once" can be the difference between a recoverable bug and an incident.
Standard OTel instrumentation captures none of this. It sees the HTTP boundary, not the reasoning inside it. What you need is an additional layer that understands agent semantics: what was the LLM asked, what did it decide, which tools did it choose and why.
What Agent Tracing Adds
You already know traces and spans from distributed systems. The model is the same — a trace is a record of one end-to-end operation, composed of nested spans. What changes for agents is what goes inside those spans.
Instead of just latency and status codes, agent spans carry:
- The full prompt sent to the LLM and its completion
- Token counts and cost per call
- Which tool was invoked, with what arguments, and what it returned
- The graph node that triggered each operation
For a LangGraph agent with human-in-the-loop tool approval, a single user message produces a trace like this:
Trace: user-message
  ├─ LangGraph: agent node
  │    └─ LLM call (GPT-4o, 1,240 tokens, 0.8s, $0.006)
  ├─ LangGraph: tool_approval node
  │    └─ interrupt (waiting for human approval)
  ├─ LangGraph: tools node
  │    └─ search_web("...") → result
  └─ LangGraph: agent node (second pass)
       └─ LLM call (GPT-4o, 380 tokens, 0.3s, $0.002)
That trace answers every question from the introduction. You can see exactly where time was spent, which LLM call was expensive, and what inputs each node received.
Why Langfuse
Langfuse is an open-source LLM observability platform built specifically for this. I'm not affiliated with Langfuse — I use it because it's open-source, does the job well, and doesn't lock you in. Here's what makes it a good fit for agent builders:
Open-source and self-hostable. All Langfuse features (traces, evals, prompt management, annotation queues, playground) are MIT licensed. You can run the full platform on your own infrastructure with Docker Compose, which means full data ownership and no vendor lock-in. This matters for teams in regulated industries or with data residency requirements.
LangGraph native. LangGraph is built on LangChain. Langfuse's CallbackHandler integrates directly with the LangChain callback system, automatically capturing every graph node execution, LLM call, and tool invocation with full semantic context.
Broad compatibility via OpenTelemetry. Beyond LangGraph, Langfuse provides native SDKs covering all major TypeScript and Python frameworks — OpenAI SDK, LiteLLM, and more. For anything not natively supported, if your stack already emits OpenTelemetry spans, Langfuse picks them up without any additional integration code. One platform covers your entire stack.
Traces are just the start. Langfuse also handles prompt management and evaluations in the same platform. Once your traces are flowing, you can run LLM-as-a-judge evals on them, collect user feedback, and build datasets for regression testing. More on that in a follow-up post.
Alternatives worth knowing: LangSmith is excellent if you're already deep in the LangChain ecosystem, but it's closed-source. Helicone offers the fastest setup (a proxy URL swap), but proxy-based tracing captures less semantic detail for complex agent graphs. Langfuse sits in the sweet spot of depth and control.
Adding Langfuse to the Fullstack Template
I recently added Langfuse support to the fullstack-langgraph-nextjs-agent template. The integration required about 26 lines of code across two files. Here's how it works.
Install
pnpm add @langfuse/langchain @langfuse/otel @opentelemetry/sdk-node
Configure
LANGFUSE_ENABLED=true
LANGFUSE_SECRET_KEY=sk-lf-...
LANGFUSE_PUBLIC_KEY=pk-lf-...
LANGFUSE_BASE_URL=https://cloud.langfuse.com
For self-hosting, swap LANGFUSE_BASE_URL to your local instance (e.g., http://localhost:3000). The setup instructions are in OBSERVABILITY.md.
Piece 1: OTel Initialization (instrumentation.ts)
According to the Langfuse OTel docs, the SDK should be initialized once per process — before any application code runs — so that the span processor is registered before the first trace is emitted. How you do that depends on your framework. For non-Next.js apps, the docs cover the setup for Node.js, Python, and other runtimes.
In Next.js, the right place is the built-in instrumentation.ts hook, which the framework calls once at process startup before any route handler executes:
export async function register() {
  if (process.env.NEXT_RUNTIME === 'nodejs' && process.env.LANGFUSE_ENABLED === 'true') {
    const { NodeSDK } = await import('@opentelemetry/sdk-node')
    const { LangfuseSpanProcessor } = await import('@langfuse/otel')

    const sdk = new NodeSDK({
      spanProcessors: [new LangfuseSpanProcessor()],
    })

    sdk.start()
  }
}
The NEXT_RUNTIME === "nodejs" guard is important. Next.js evaluates instrumentation.ts in both the Node.js runtime and the Edge runtime. The OTel SDK uses Node.js-only APIs that would crash in Edge context. Dynamic imports prevent Next.js from bundling these modules for the Edge bundle.
Piece 2: Semantic Callbacks (agentService.ts)
The OTel processor captures infrastructure spans (HTTP calls, DB queries). To capture agent-specific semantics — LLM inputs/outputs, token counts, tool names — we need to hook into LangGraph's execution. Langfuse does this through LangChain's callback system.
Callbacks are the right pattern here for two reasons. First, they're async and fire out-of-band: sending trace data to Langfuse adds no latency to your agent's response time. Second, they're isolated: if the Langfuse endpoint is down or a tracing call fails, it doesn't throw in your agent's execution path. Observability that can take down your agent isn't observability you can trust in production.
We attach a CallbackHandler to each agent.stream() call:
import { CallbackHandler } from '@langfuse/langchain'

const langfuseHandler = process.env.LANGFUSE_ENABLED === 'true' ? new CallbackHandler() : null

// In streamResponse():
const iterable = await agent.stream(inputs, {
  configurable: { thread_id: threadId },
  ...(langfuseHandler ? { callbacks: [langfuseHandler] } : {}),
})
When LANGFUSE_ENABLED is false or missing, the handler is null and the spread adds nothing. Zero overhead, no silent errors from missing credentials, no code changes needed to disable.
What You See in the Dashboard
Here's the agent running in the browser — a standard chat interface backed by the LangGraph agent:
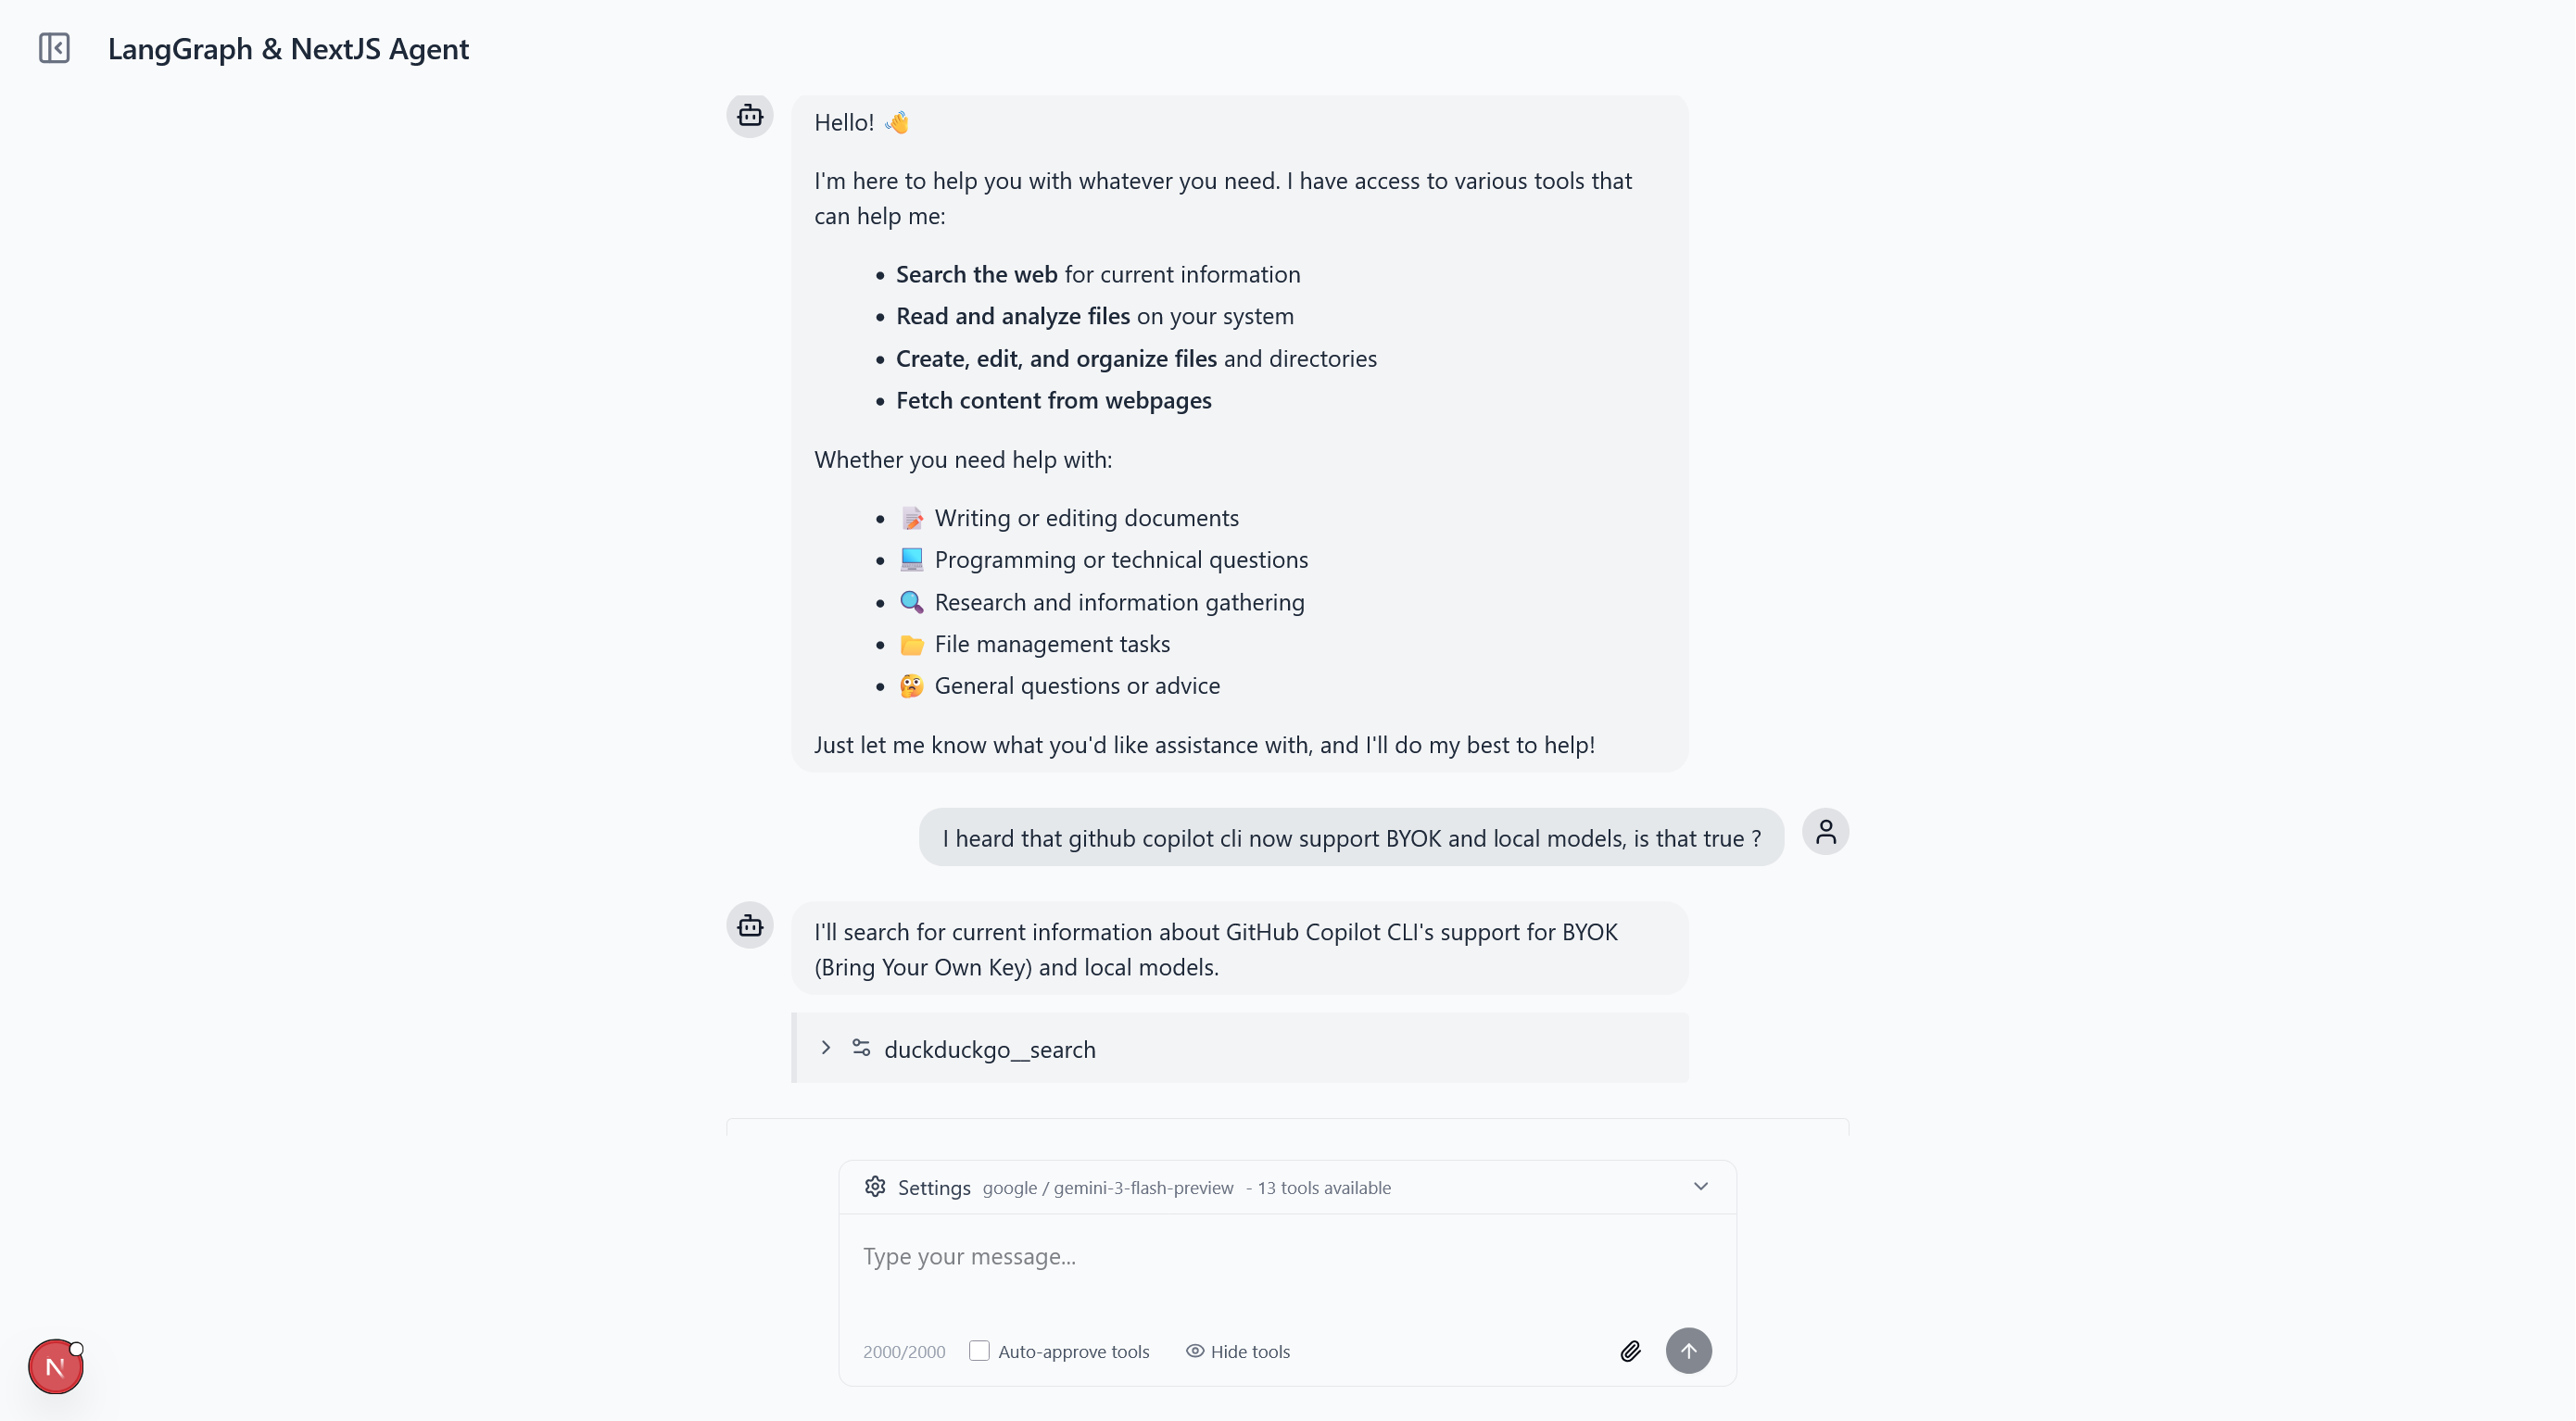
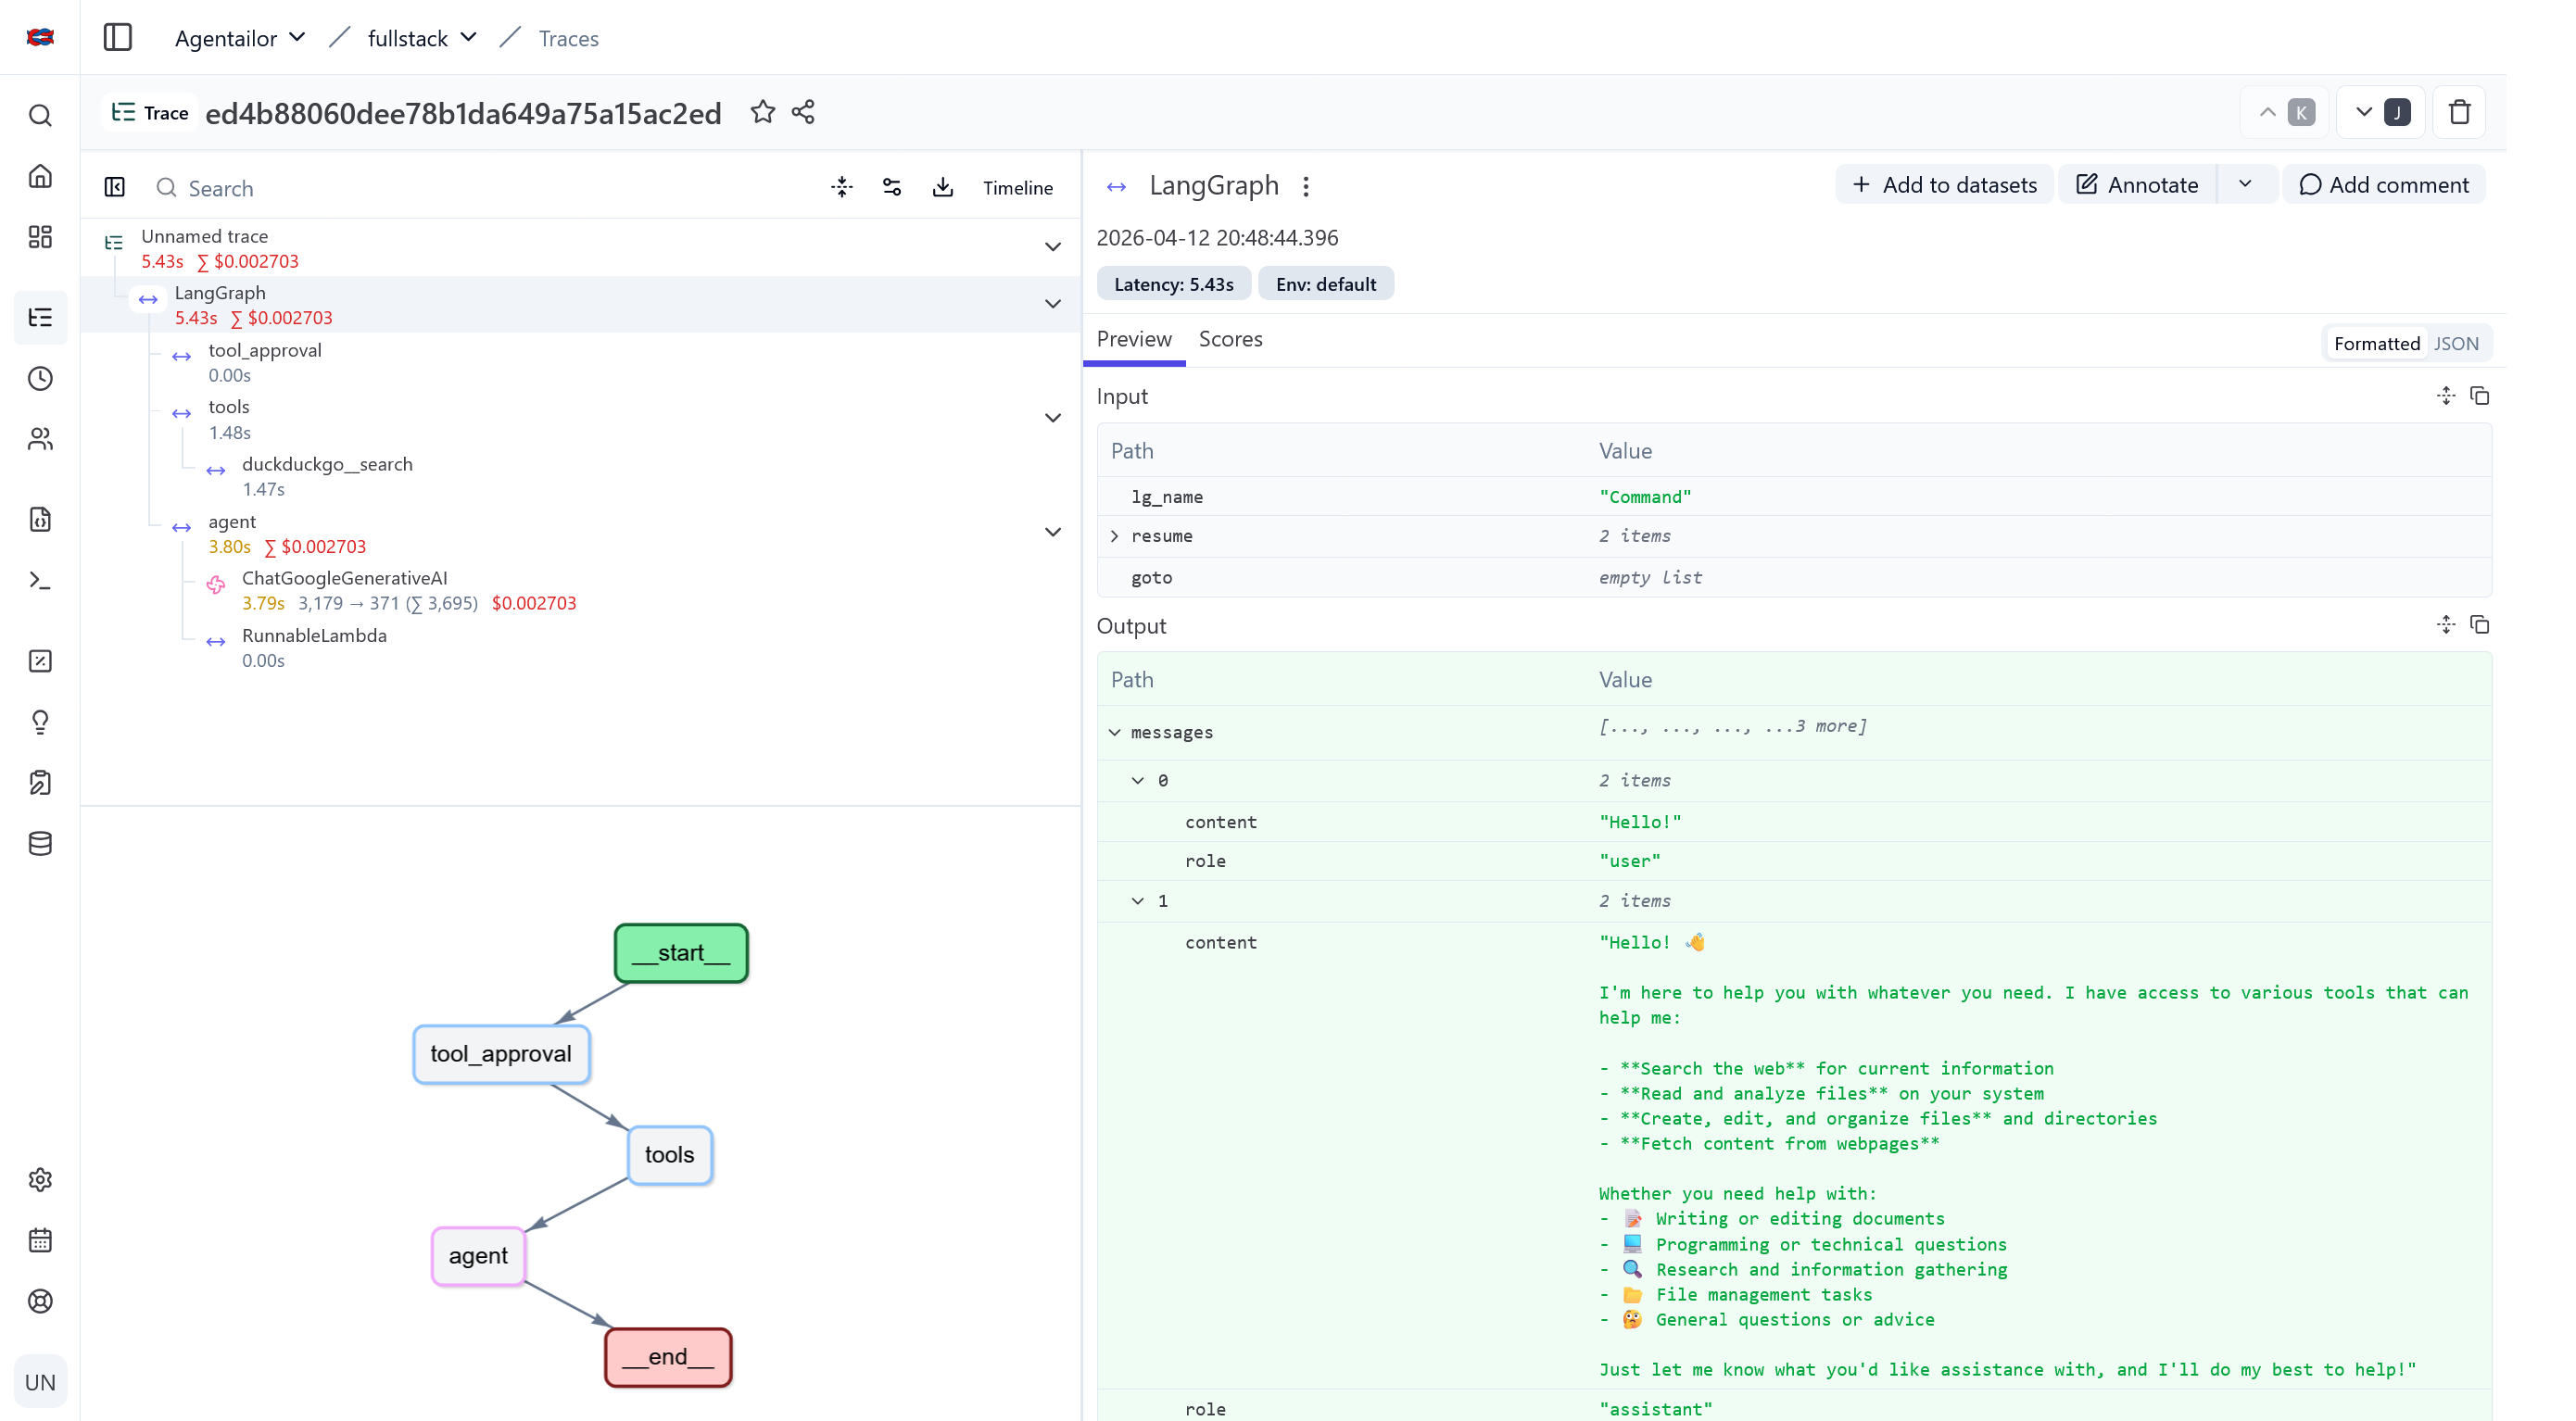
Every conversation that goes through that UI generates a trace. Once traces are flowing, Langfuse gives you a hierarchical view of each agent run — the full node execution sequence, nested LLM calls with token counts and costs, tool invocations with their inputs and outputs, and latency at every step.
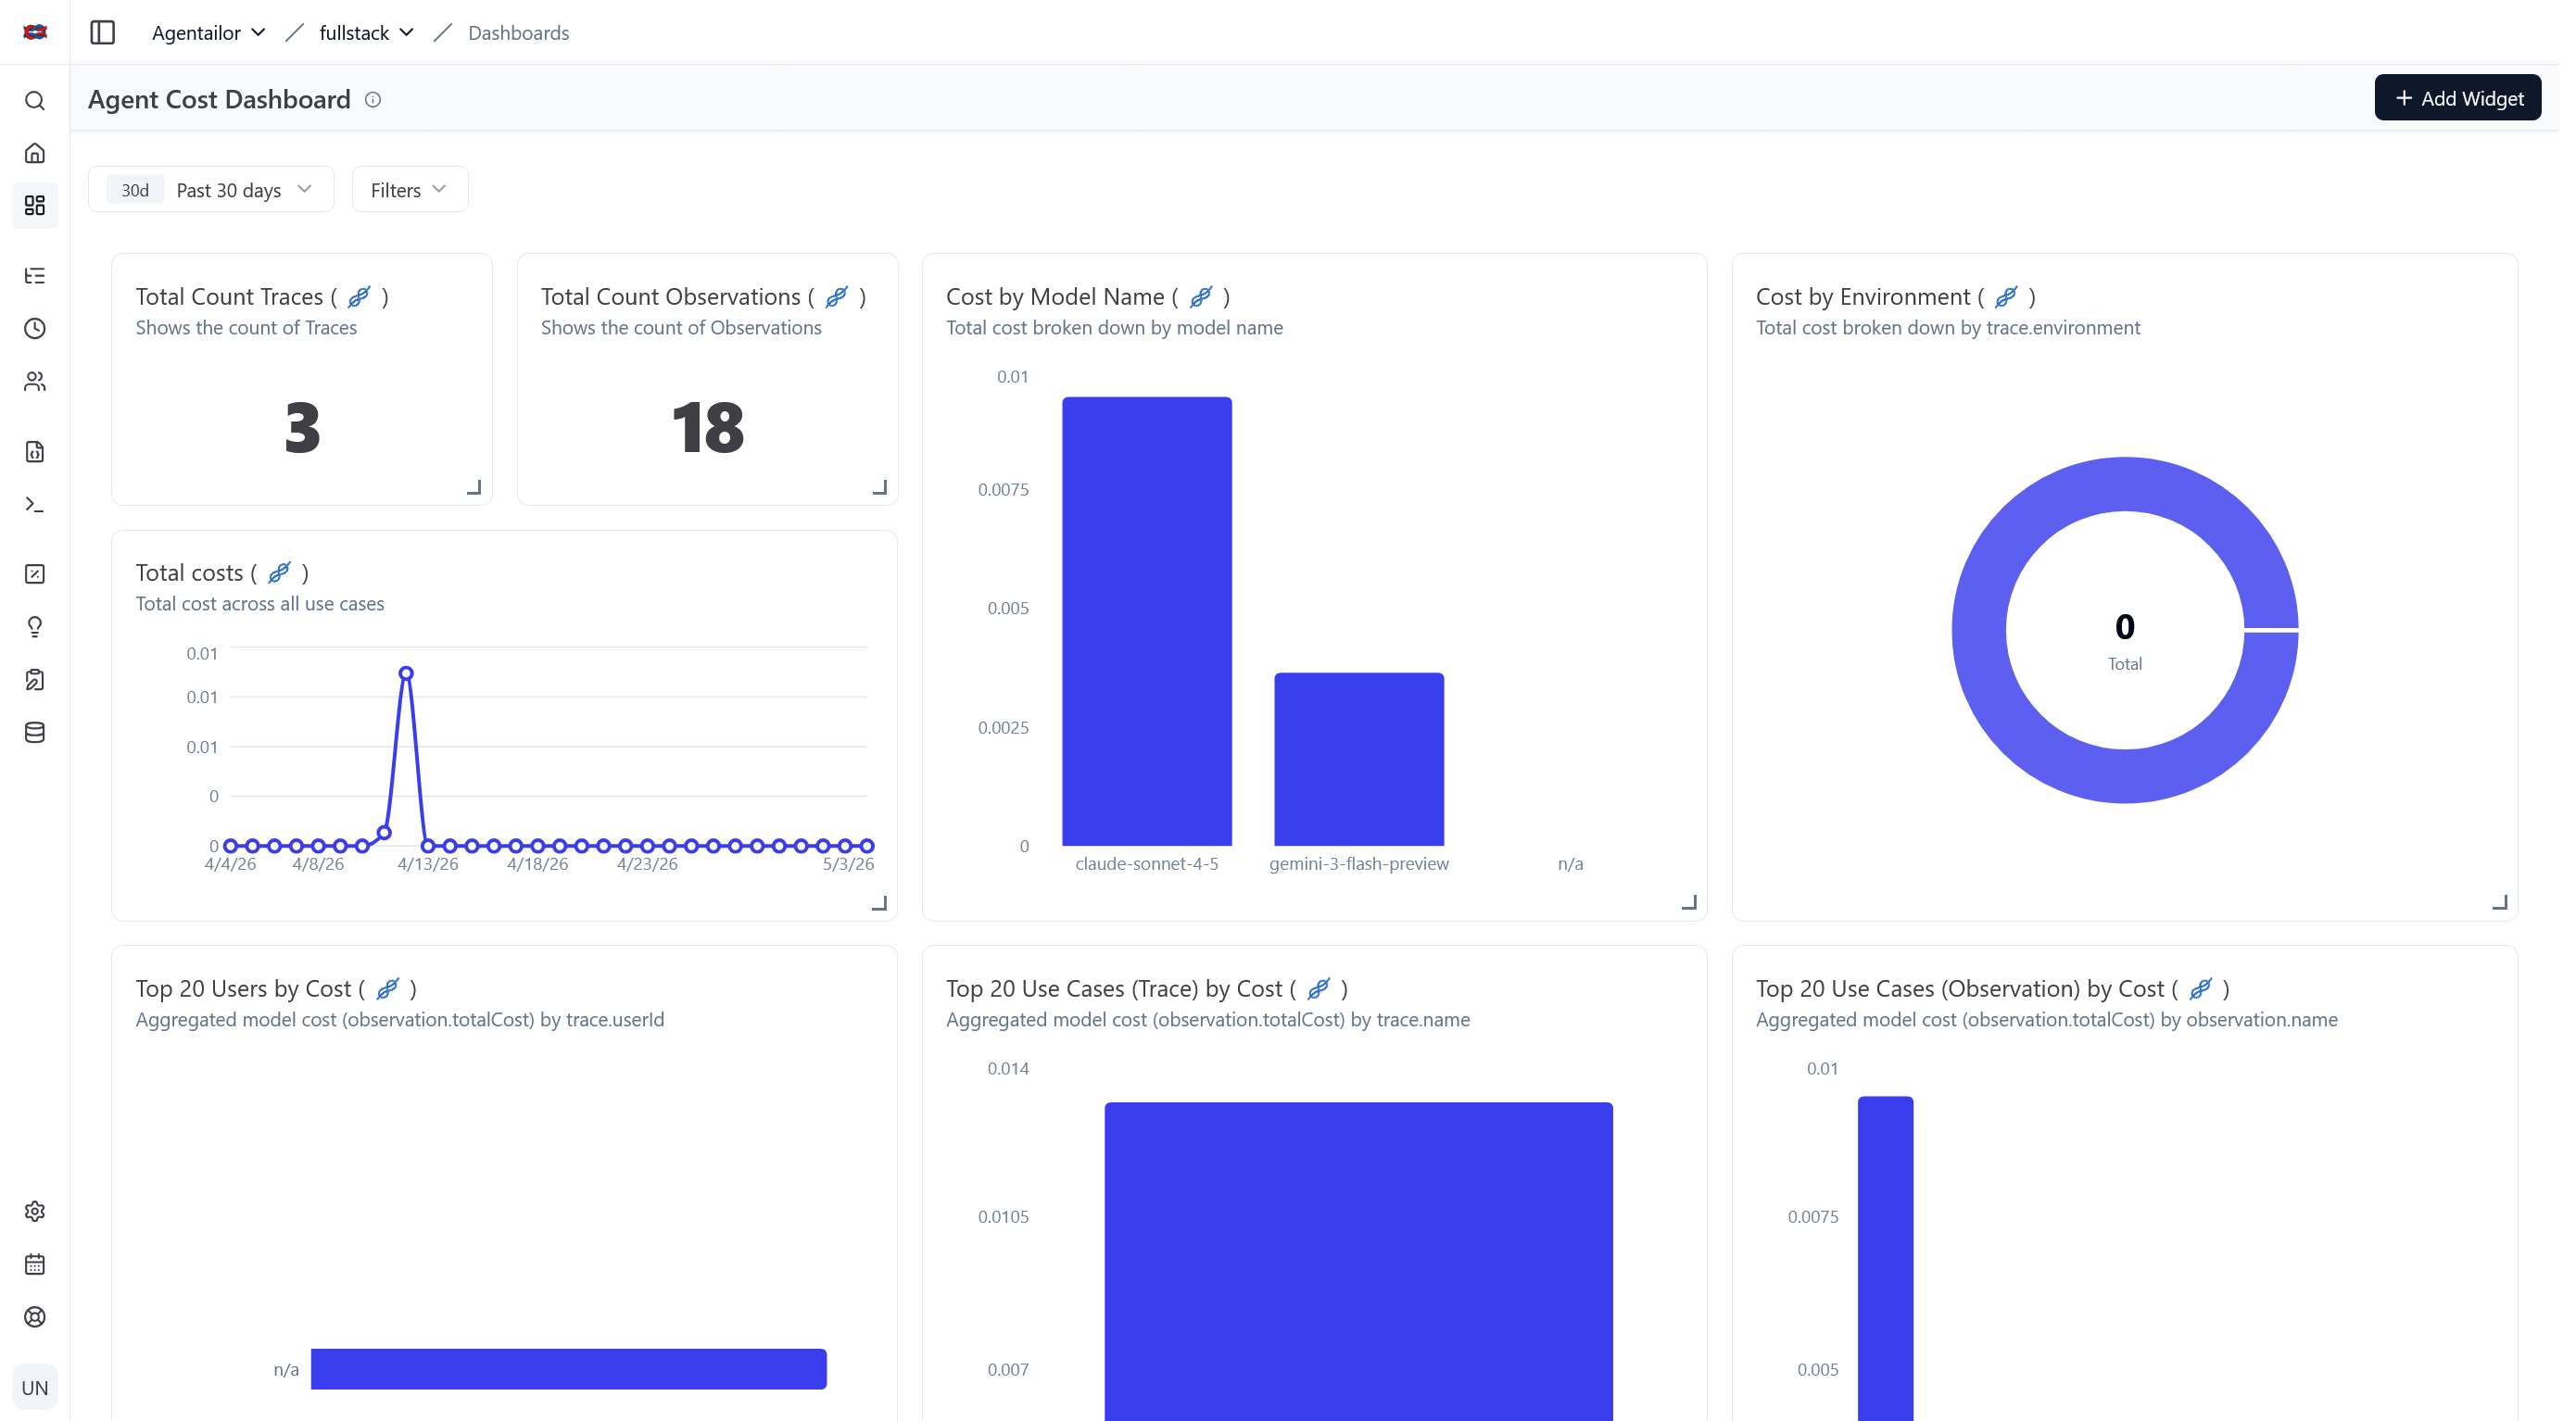
At the project level you get aggregated cost and latency trends over time, which makes it easy to spot regressions after prompt or model changes.
Quick Start
The template has Langfuse support built in. Clone it and add your keys:
git clone https://github.com/agentailor/fullstack-langgraph-nextjs-agent
cd fullstack-langgraph-nextjs-agent
pnpm install
# Copy .env.example to .env.local and fill in LANGFUSE_* vars
pnpm dev
Traces appear in your Langfuse project the moment the agent handles its first message. For self-hosting instructions, see the OBSERVABILITY.md.
Conclusion
Observability isn't an optional extra for production agents. It's how you move from "I think it's working" to "I can prove why it works and catch it when it doesn't."
Langfuse gives you traces. But traces are the foundation, not the destination. Once you have a record of what your agent does, the next step is evaluations: systematically measuring output quality, catching regressions when you change a prompt, and building datasets that let you iterate with confidence.
That's the next article.
Enjoying content like this? Sign up for Agent Briefings, where I share insights and news on building and scaling AI agents.
Resources
- Fullstack LangGraph + Next.js Template (GitHub) — complete implementation with Langfuse built in
- OBSERVABILITY.md — setup guide including self-hosting
- Langfuse Docs — official documentation
- Langfuse LangGraph Integration — official cookbook