· 14 min read
How to Build and Deploy an Agent Skill from Scratch
AI agents are only as useful as the skills they have. In this guide, we build a complete Agent Skill from scratch—a data visualization skill that generates financial reports with Chart.js and deploy it to a personal finance assistant called Cameron AI.
Copy a command, then paste it into the command palette (Ctrl K to open).
Introduction
AI agents are increasingly capable, but they often lack the specialized knowledge needed for real work. Your agent might write code, but does it know your team's deployment process? It can analyze data, but does it understand your company's reporting standards?
Agent Skills solve this by packaging domain expertise, workflows, and context into portable folders that agents can discover and use on demand.
What you'll build:
In this guide, you'll create a skill that teaches AI agents how to generate beautiful financial reports with charts and insights—building on Cameron AI, the personal finance assistant from our previous articles on agent prompting and tool design.
What Are Agent Skills?
Agent Skills are folders containing instructions, scripts, and resources that AI tools can discover and use. Think of them as training documents for your AI assistant, except they load automatically when relevant.
The key insight is progressive disclosure. When your agent starts, it only loads the name and description of each skill—roughly 100 tokens per skill. This means you can have dozens of skills available without bloating your context window. Your agent stays fast and focused, pulling in detailed guidance only when needed.
Skills vs MCP: Complementary, Not Competing
If you've worked with MCP servers, you might wonder how skills fit in. Here's the distinction:
| Aspect | Agent Skills | MCP Servers |
|---|---|---|
| Purpose | Teach workflows and knowledge | Provide tools and capabilities |
| Format | Single SKILL.md file | Server code (TypeScript, Python) |
| Example | "How to write agent prompts" | "Fetch URL", "Query database" |
Skills provide the knowledge; MCP provides the capabilities. A skill might instruct an agent to "fetch the API documentation and analyze it", while an MCP server provides the actual fetch tool.
For a deeper dive, see the official Agent Skills specification.
Understanding SKILL.md Format
Every skill is a folder containing a SKILL.md file. This file has two parts: YAML frontmatter and markdown instructions.
Required Fields
| Field | Max Length | Description |
|---|---|---|
name | 64 chars | Lowercase letters, numbers, and hyphens only |
description | 1024 chars | When and why to use this skill |
The description is crucial, it's what the AI uses to decide when to activate your skill. Include specific keywords that match how users naturally ask for help.
Note: The specification supports additional optional fields (
license,compatibility,allowed-tools, etc.). See the official documentation for the complete list.
Building the Cameron Expense Reporter Skill
Let's build a skill for Cameron AI, a personal finance assistant that helps users manage budgets and track expenses.
For simplicity, we'll suppose that Cameron has file system access via MCP and can execute JavaScript in a sandboxed environment—the infrastructure needed to discover and run skills.
The skill we're building will teach Cameron how to transform raw expense data into professional visualizations with Chart.js.
Context: If you're new to Cameron AI, check out:
- The Art of Agent Prompting: How Cameron's prompts are designed
- Writing Tools for AI Agents: How Cameron's
cameron_get_expensestool works
What you'll build: A complete skill with:
- 6-step visualization workflow (understand request → gather data → format → generate chart → add insights → compose report)
- Helper scripts for Chart.js configuration and data formatting
- Reference guides for chart type selection
- HTML template for professional reports
Full implementation: The complete skill is available on GitHub. We'll show function signatures and key patterns here.
Step 1: Create the Skill Directory
Create a folder structure for your skill:
mkdir -p my-skills/cameron-expense-reporter
cd my-skills/cameron-expense-reporter

# Create subdirectories for supporting files
mkdir -p scripts references assets
This skill will use:
- scripts/: Reusable JavaScript utilities for charts and data formatting
- references/: Decision guides and complete examples
- assets/: HTML templates for professional output
Step 2: Write the Frontmatter
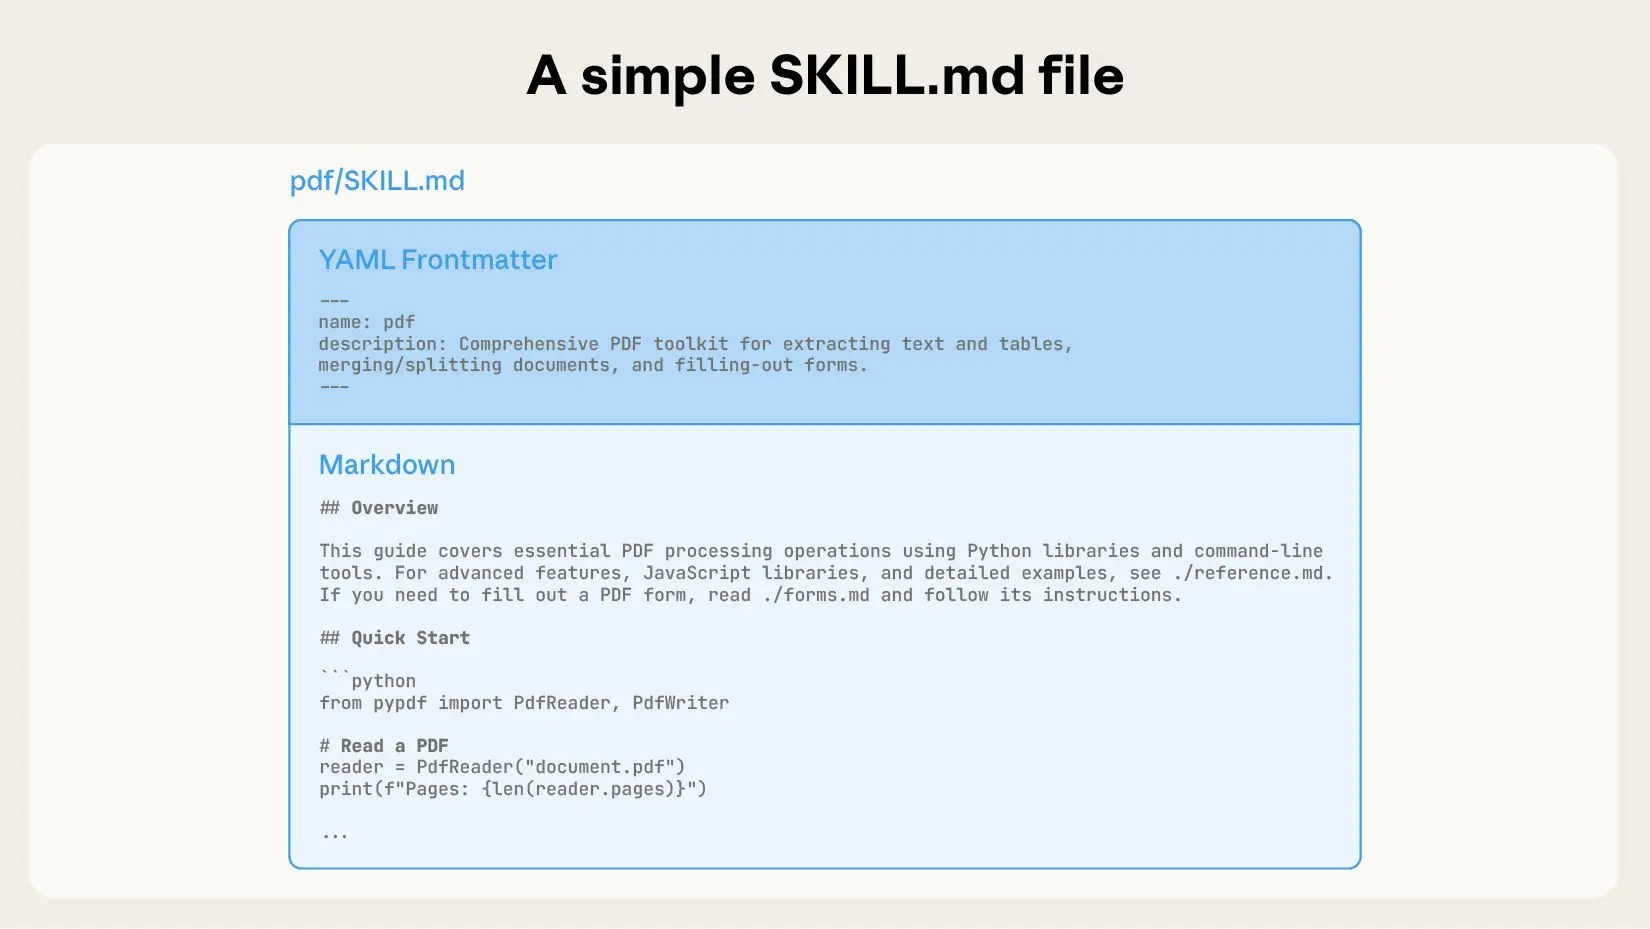
Create SKILL.md with frontmatter that clearly describes when to activate this skill:
---
name: cameron-expense-reporter
description: Generate financial reports with charts using Chart.js. Use when users ask to visualize spending, show trends, create expense charts, analyze spending patterns, compare categories, track budget progress, or generate financial reports. Handles chart type selection (bar/line/pie), data formatting (currency, dates, aggregation), Chart.js configuration, and insight generation. Works with expense data from tools like cameron_get_expenses or similar financial data sources.
---
Key decisions:
- name: Scoped to Cameron's domain with clear purpose (we can also just use expense-reporter)
- description: Includes natural trigger phrases users would say ("visualize spending", "show trends", "expense charts")
The description is critical, it determines when the AI loads this skill. Include synonyms and common phrasings.
Step 3: Define the Workflow
After frontmatter, add the skill title and a 6-step workflow:
# Cameron Expense Reporter

Generate beautiful, insightful financial reports with charts and written analysis.

## Workflow

### Step 1: Understand the Request

Identify the user's intent to select the appropriate visualization:

- Category comparison → Bar chart
- Time-series trends → Line chart
- Distribution/proportions → Pie chart
- Budget tracking → Line chart with budget reference line

### Step 2: Gather Expense Data

Use the `cameron_get_expenses` tool to retrieve relevant data...

### Step 3: Prepare and Format Data

Use helper scripts for data transformation...

### Step 4: Generate Chart Configuration

Use helper scripts to create Chart.js configurations...

### Step 5: Generate Insights

Provide written analysis alongside the chart...

### Step 6: Compose the Report

Generate HTML, markdown, or inline visualization...
Why 6 steps: Each represents a distinct decision point in the visualization workflow. This guides the AI through: intent recognition → data retrieval → transformation → rendering → analysis → output.
Step 4: Add Supporting Scripts
For complex logic, extract reusable functions into scripts. Create two JavaScript utilities:
scripts/format_financial_data.js — Data transformation:
/**
 * Aggregate expenses by category
 */
function aggregateByCategory(expenses) {
  return expenses.reduce((acc, expense) => {
    const category = expense.category || 'Other'
    acc[category] = (acc[category] || 0) + expense.amount
    return acc
  }, {})
}

/**
 * Prepare expense data for visualization
 */
function prepareChartData(expenses, aggregationType = 'category', sortByValue = true) {
  let aggregated

  switch (aggregationType) {
    case 'category':
      aggregated = aggregateByCategory(expenses)
      break
    case 'month':
      aggregated = aggregateByMonth(expenses)
      break
    case 'week':
      aggregated = aggregateByWeek(expenses)
      break
  }

  if (sortByValue && aggregationType === 'category') {
    aggregated = sortByAmount(aggregated)
  }

  return toChartFormat(aggregated)
}

// Also includes: aggregateByMonth, aggregateByWeek, formatCurrency,
// calculatePercentageChange, formatDateRange, toChartFormat, sortByAmount
scripts/generate_chart_config.js — Chart.js configuration:
/**
 * Generate a bar chart configuration for categorical spending data
 */
function generateBarChart({ title, labels, data, currency = '$' }) {
  return {
    type: 'bar',
    data: {
      labels: labels,
      datasets: [
        {
          label: 'Spending',
          data: data,
          backgroundColor: 'rgba(59, 130, 246, 0.8)',
          borderColor: 'rgba(59, 130, 246, 1)',
          borderWidth: 1,
        },
      ],
    },
    options: {
      responsive: true,
      maintainAspectRatio: false,
      plugins: {
        title: { display: true, text: title, font: { size: 16, weight: 'bold' } },
        tooltip: {
          callbacks: {
            label: function (context) {
              return currency + context.parsed.y.toFixed(2)
            },
          },
        },
      },
      scales: {
        y: {
          beginAtZero: true,
          ticks: { callback: (value) => currency + value.toFixed(0) },
        },
      },
    },
  }
}

// Also includes: generateLineChart, generatePieChart
Why scripts: Instead of inlining complex logic in SKILL.md, extract to reusable functions the AI can read and execute.
Full implementations: See the complete skill on GitHub for all utility functions.
Step 5: Add Reference Guides
For decision logic, use reference documents the AI loads on-demand:
references/chart-types-guide.md — Chart selection decision tree:
## Decision Tree

### Categorical Comparison ("Which category did I spend most on?")

**Use: Bar Chart**

Best for:

- Comparing spending across categories
- Showing top spending categories

Example queries:

- "What are my biggest expenses?"
- "Show spending by category"

### Time-Series Trends ("How is my spending changing?")

**Use: Line Chart**

Best for:

- Showing spending trends over weeks/months
- Comparing to budget over time

Example queries:

- "Show my spending trends over the year"
- "How has my spending changed?"

### Distribution/Proportions ("Where does my money go?")

**Use: Pie Chart**

Best for:

- Showing percentage breakdown
- Understanding spending distribution

Example queries:

- "Where does my money go?"
- "What percentage do I spend on dining?"
Why references: Separates decision-making guidance from the main workflow. The SKILL.md references this guide: "For chart selection, see [references/chart-types-guide.md]".
The skill also includes:
- references/chartjs-examples.md: Complete HTML examples for each chart type
- assets/report-template.html: Professional HTML template with placeholders
Step 6: Reference Supporting Files in SKILL.md
In your workflow, tell the AI when to use these resources:
### Step 1: Understand the Request

Identify the user's intent to select the appropriate visualization.

For detailed chart selection guidance, see [references/chart-types-guide.md](references/chart-types-guide.md).

### Step 2: Gather Expense Data

Use the `cameron_get_expenses` tool (or equivalent) to retrieve relevant data:

### Step 3: Prepare and Format Data

**Load the formatting utilities:**

<!-- Read and use scripts/format_financial_data.js -->

### Step 4: Generate Chart Configuration

**Load the chart generator:**

<!-- Read and use scripts/generate_chart_config.js -->
Progressive disclosure: Reference files are loaded on-demand by the AI when needed. You don't inline everything in SKILL.md.
Step 7: Add Best Practices to SKILL.md
Include guidance on edge cases and performance:
## Best Practices

**Data preparation:**

- Always validate date ranges before querying
- Handle empty results gracefully
- Round currency to 2 decimal places for display

**Chart configuration:**

- Use consistent color scheme (blue primary, red for warnings)
- Set responsive: true for all charts
- Format currency in tooltips and axis ticks

**Insight generation:**

- Lead with the most important finding
- Use concrete numbers, not vague language ("Dining increased 15%" not "You spent more on dining")
- Provide context (percentages, comparisons)

**Performance:**

- For large datasets (>1000 expenses), aggregate before visualizing
- Use `response_format: 'concise'` when fetching chart data
Step 8: Validate the Complete Skill
Verify your skill has all components:
cameron-expense-reporter/
├── SKILL.md                          ✓ Main instructions with 6-step workflow
├── scripts/
│   ├── generate_chart_config.js      ✓ Bar, line, pie chart generators
│   └── format_financial_data.js      ✓ Aggregation and formatting utilities
├── references/
│   ├── chart-types-guide.md          ✓ Chart selection decision tree
│   └── chartjs-examples.md           ✓ Complete working examples
└── assets/
    └── report-template.html          ✓ HTML template for reports
Validation checklist:
- SKILL.md has frontmatter with clear trigger phrases
- Workflow is step-by-step and actionable
- Supporting scripts have clear function signatures
- References are linked from main SKILL.md with relative paths
- All examples use consistent patterns (Chart.js v4, Tailwind colors)
Get the complete skill: GitHub repository
Testing Your Skill
Now let's install and test the skill.
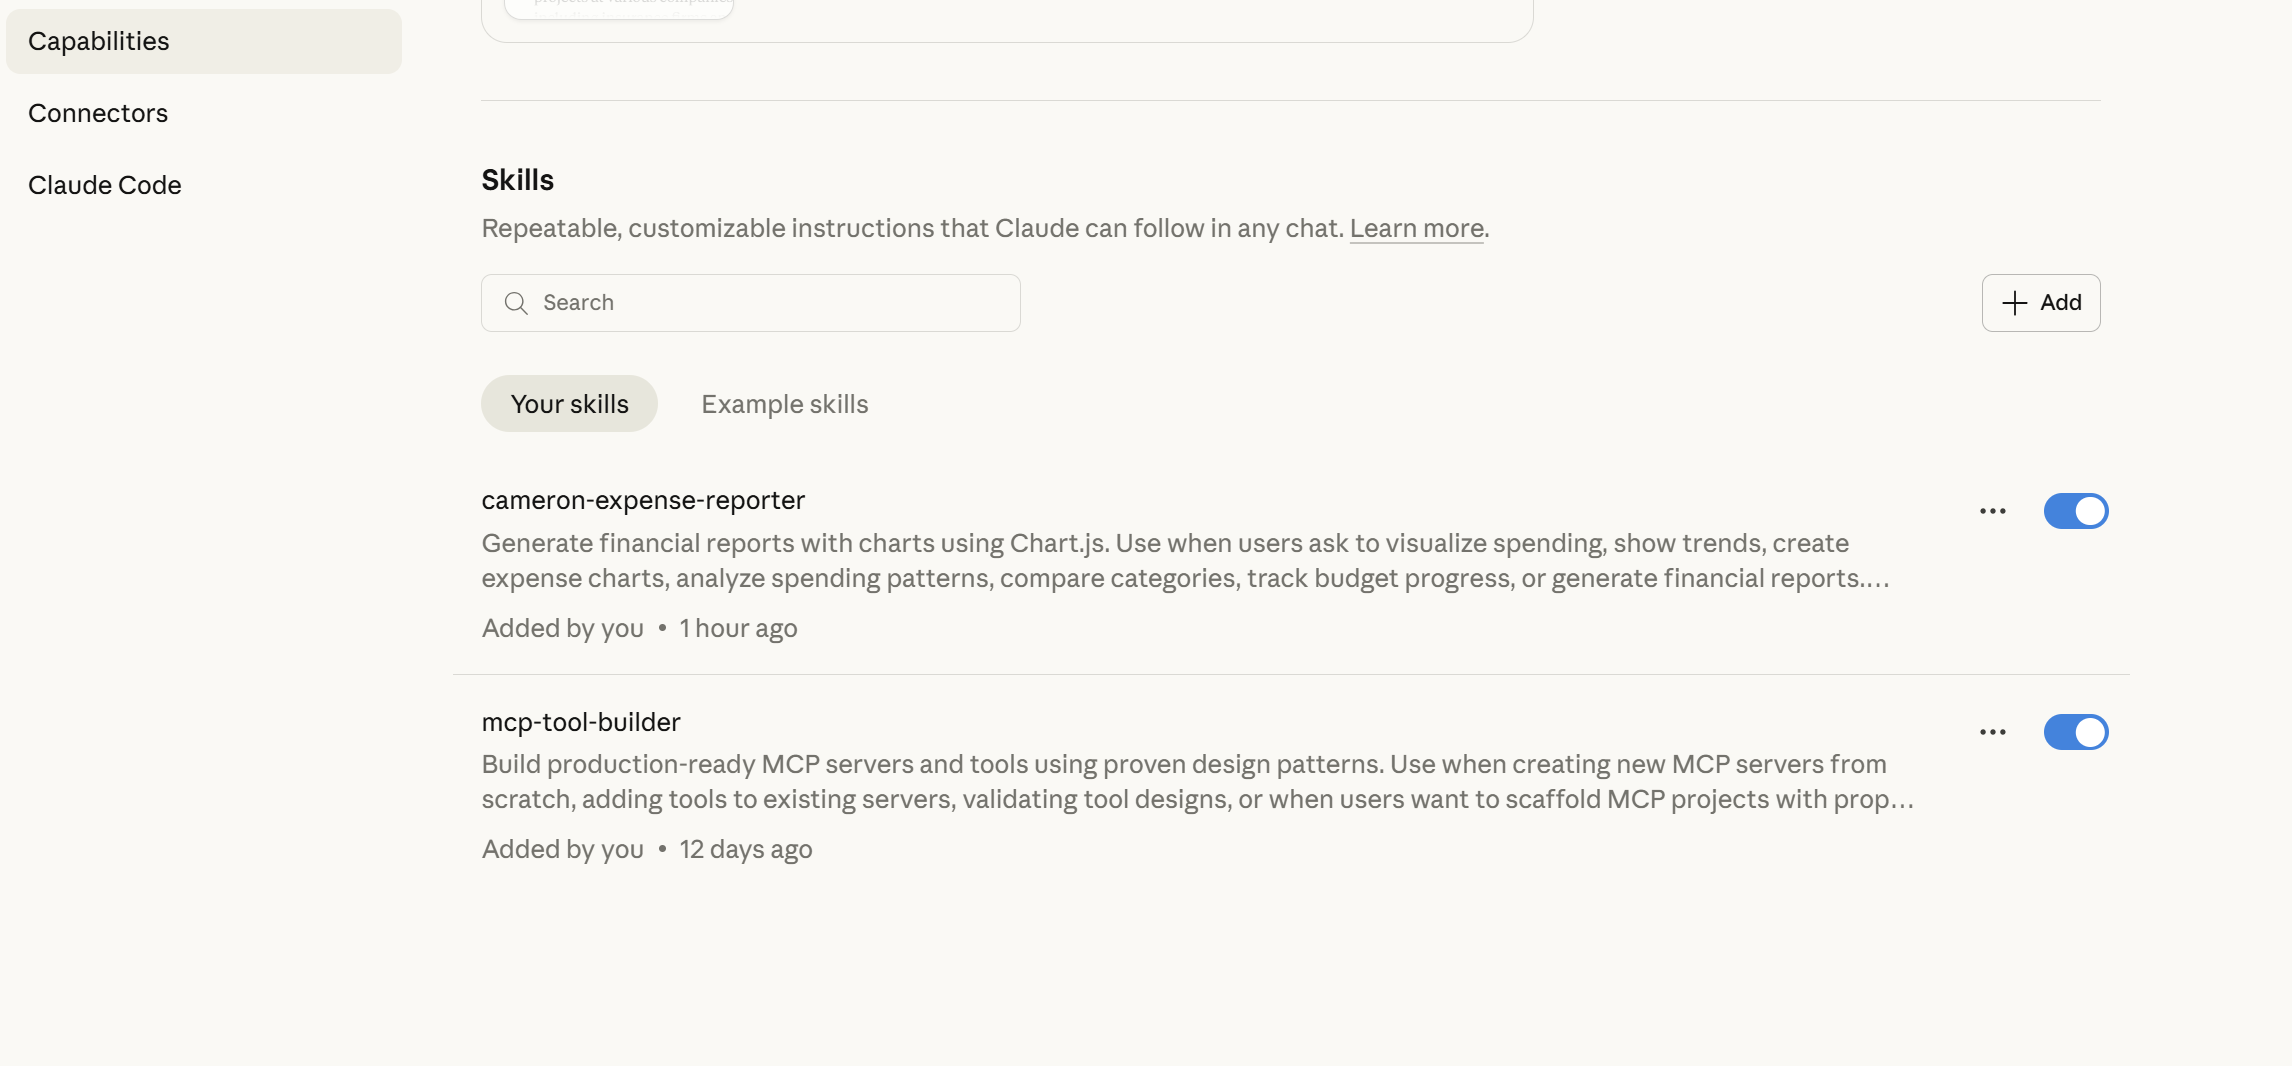
Install in Claude
The quickest way to test is with Claude.ai or Claude Desktop:
Note: If you are using the final Github repo skill, make sure to remove the expenses.csv file from the root of the skill folder before zipping and uploading to Claude.
- Zip your skill folder:
zip -r cameron-expense-reporter.zip cameron-expense-reporter/ - Go to Settings > Capabilities and ensure "Code execution and file creation" is enabled
- Scroll to the Skills section and click Upload skill
- Upload your ZIP file
For details, see Using Skills in Claude.
Other tools: You're not limited to Claude, any skills-compatible agent works. For example, in Cursor, place your skill folder in
.cursor/skills/. You can also use skills.sh to install skills across tools with a single command:npx skills add <owner/repo>.
Test with Sample Data
Download the sample expenses CSV and try this prompt:
Here are my expenses [attach the CSV file]. Can you create a report using the cameron-expense-reporter skill?
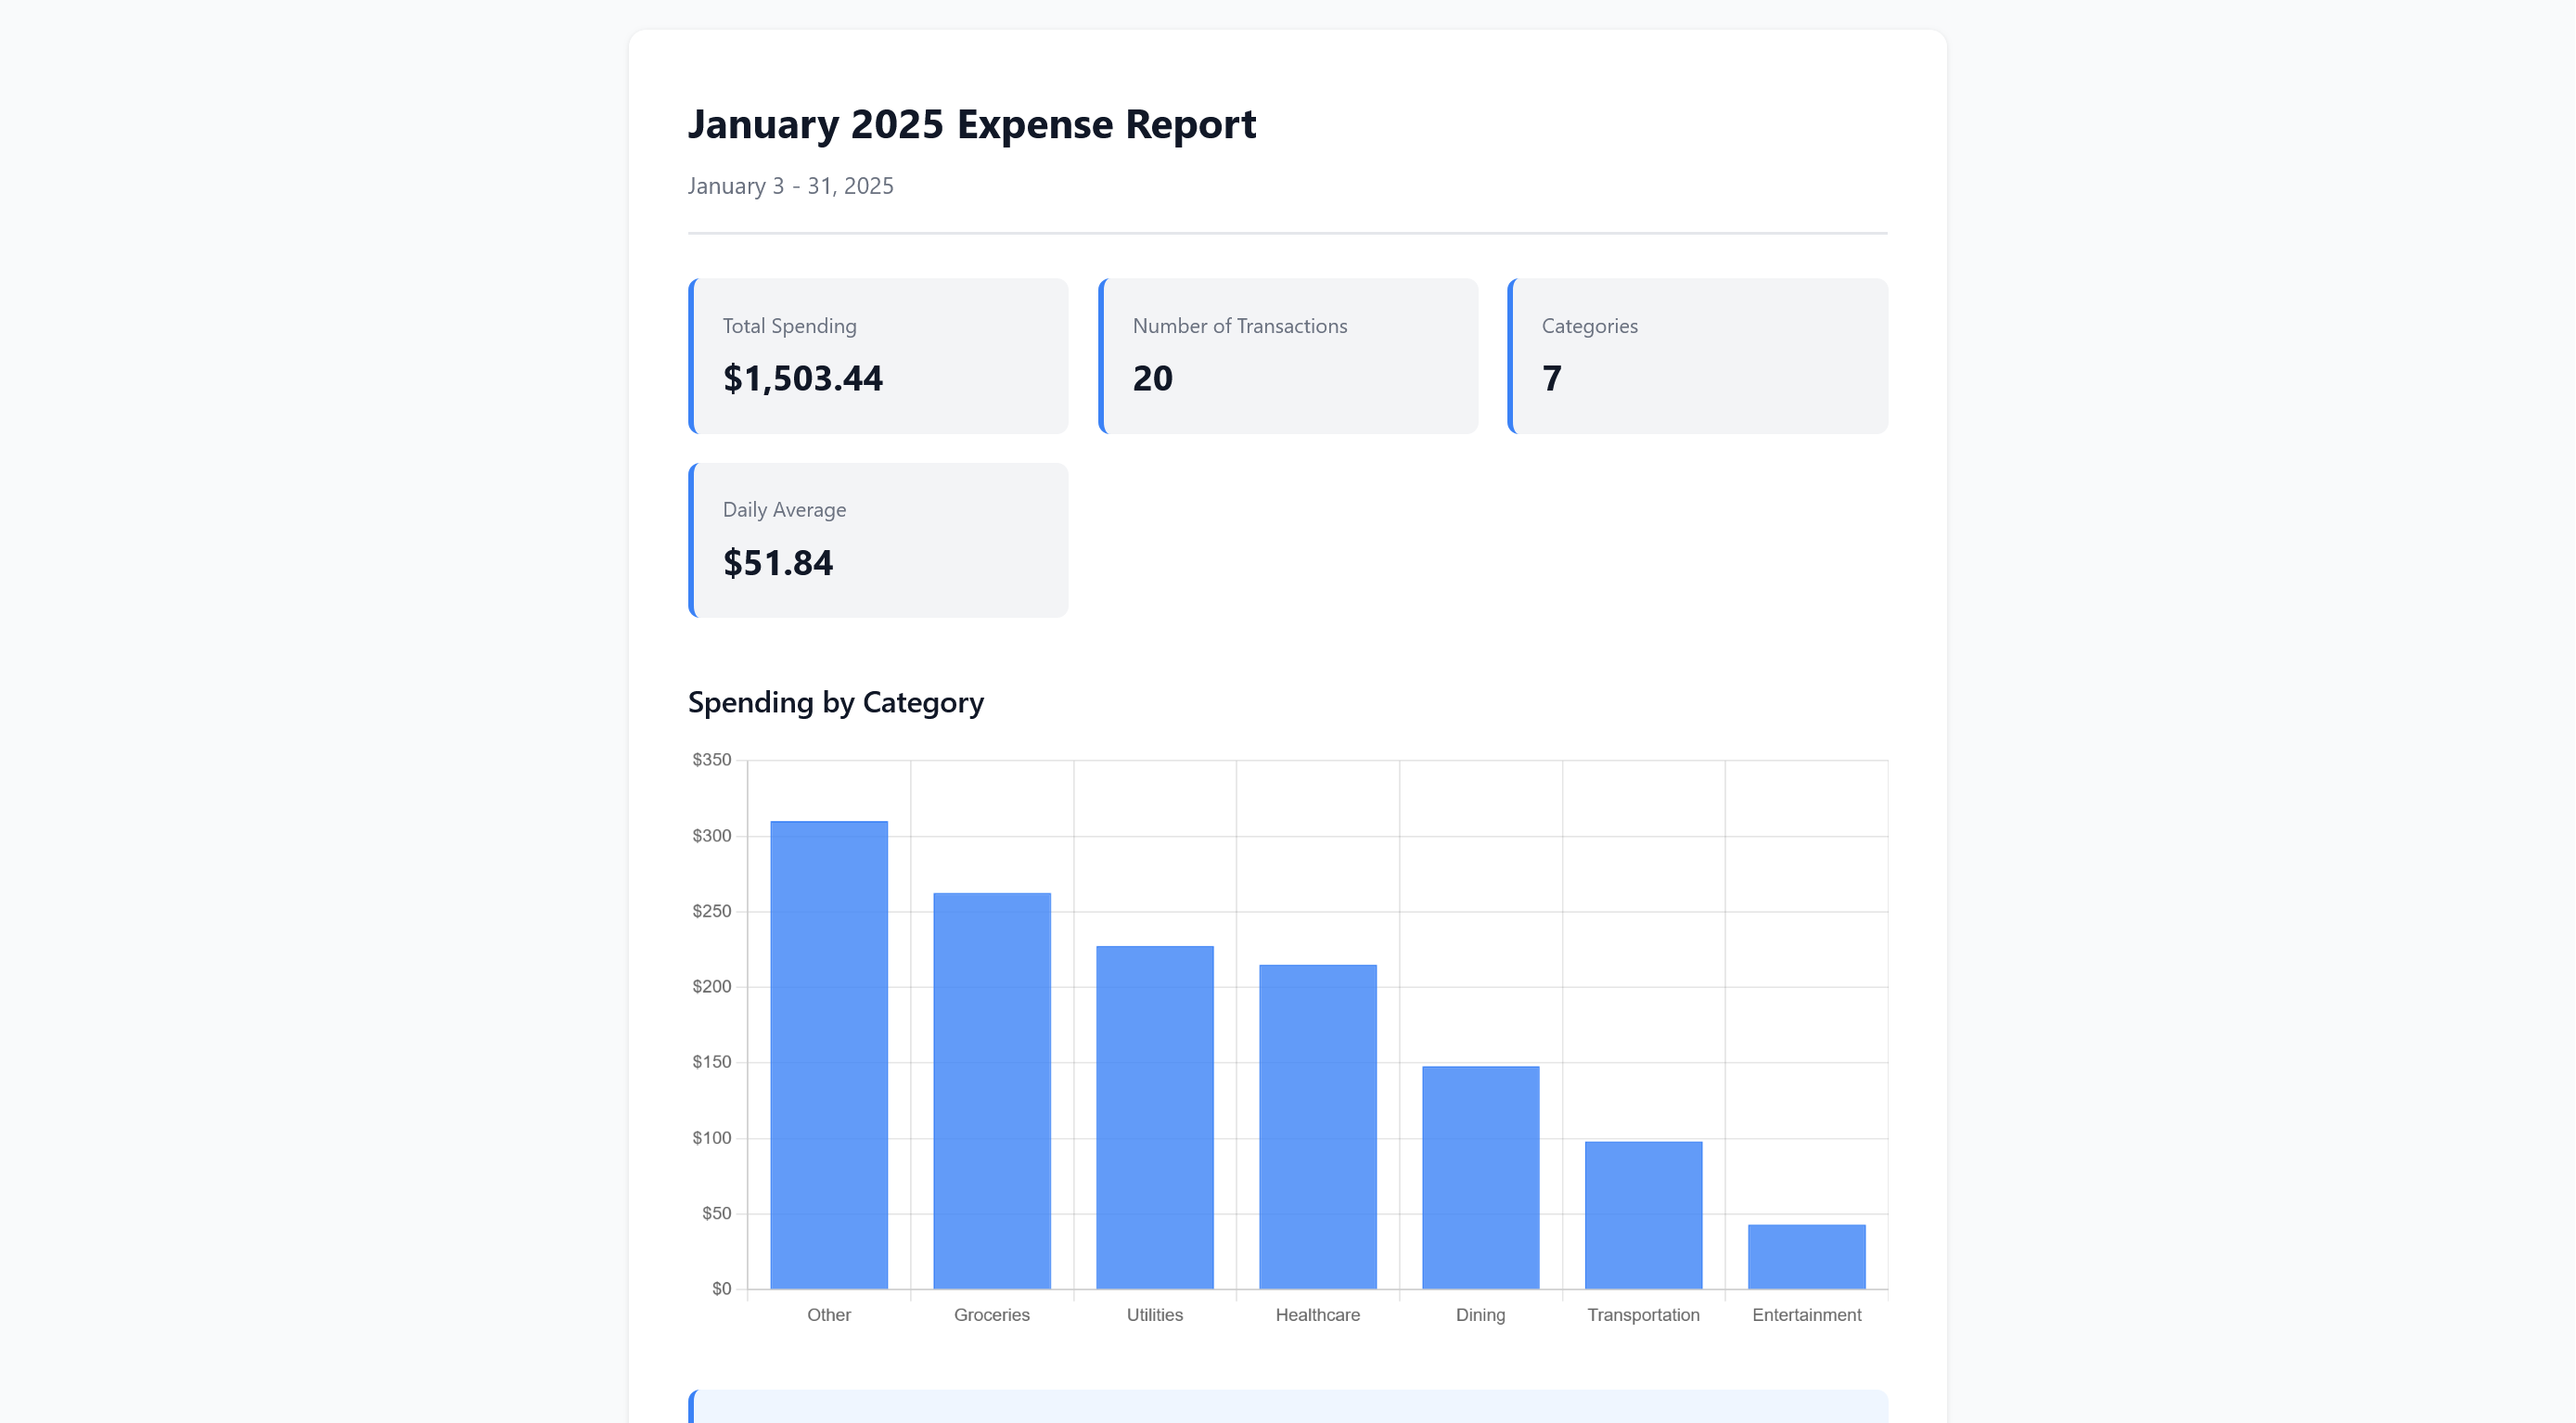
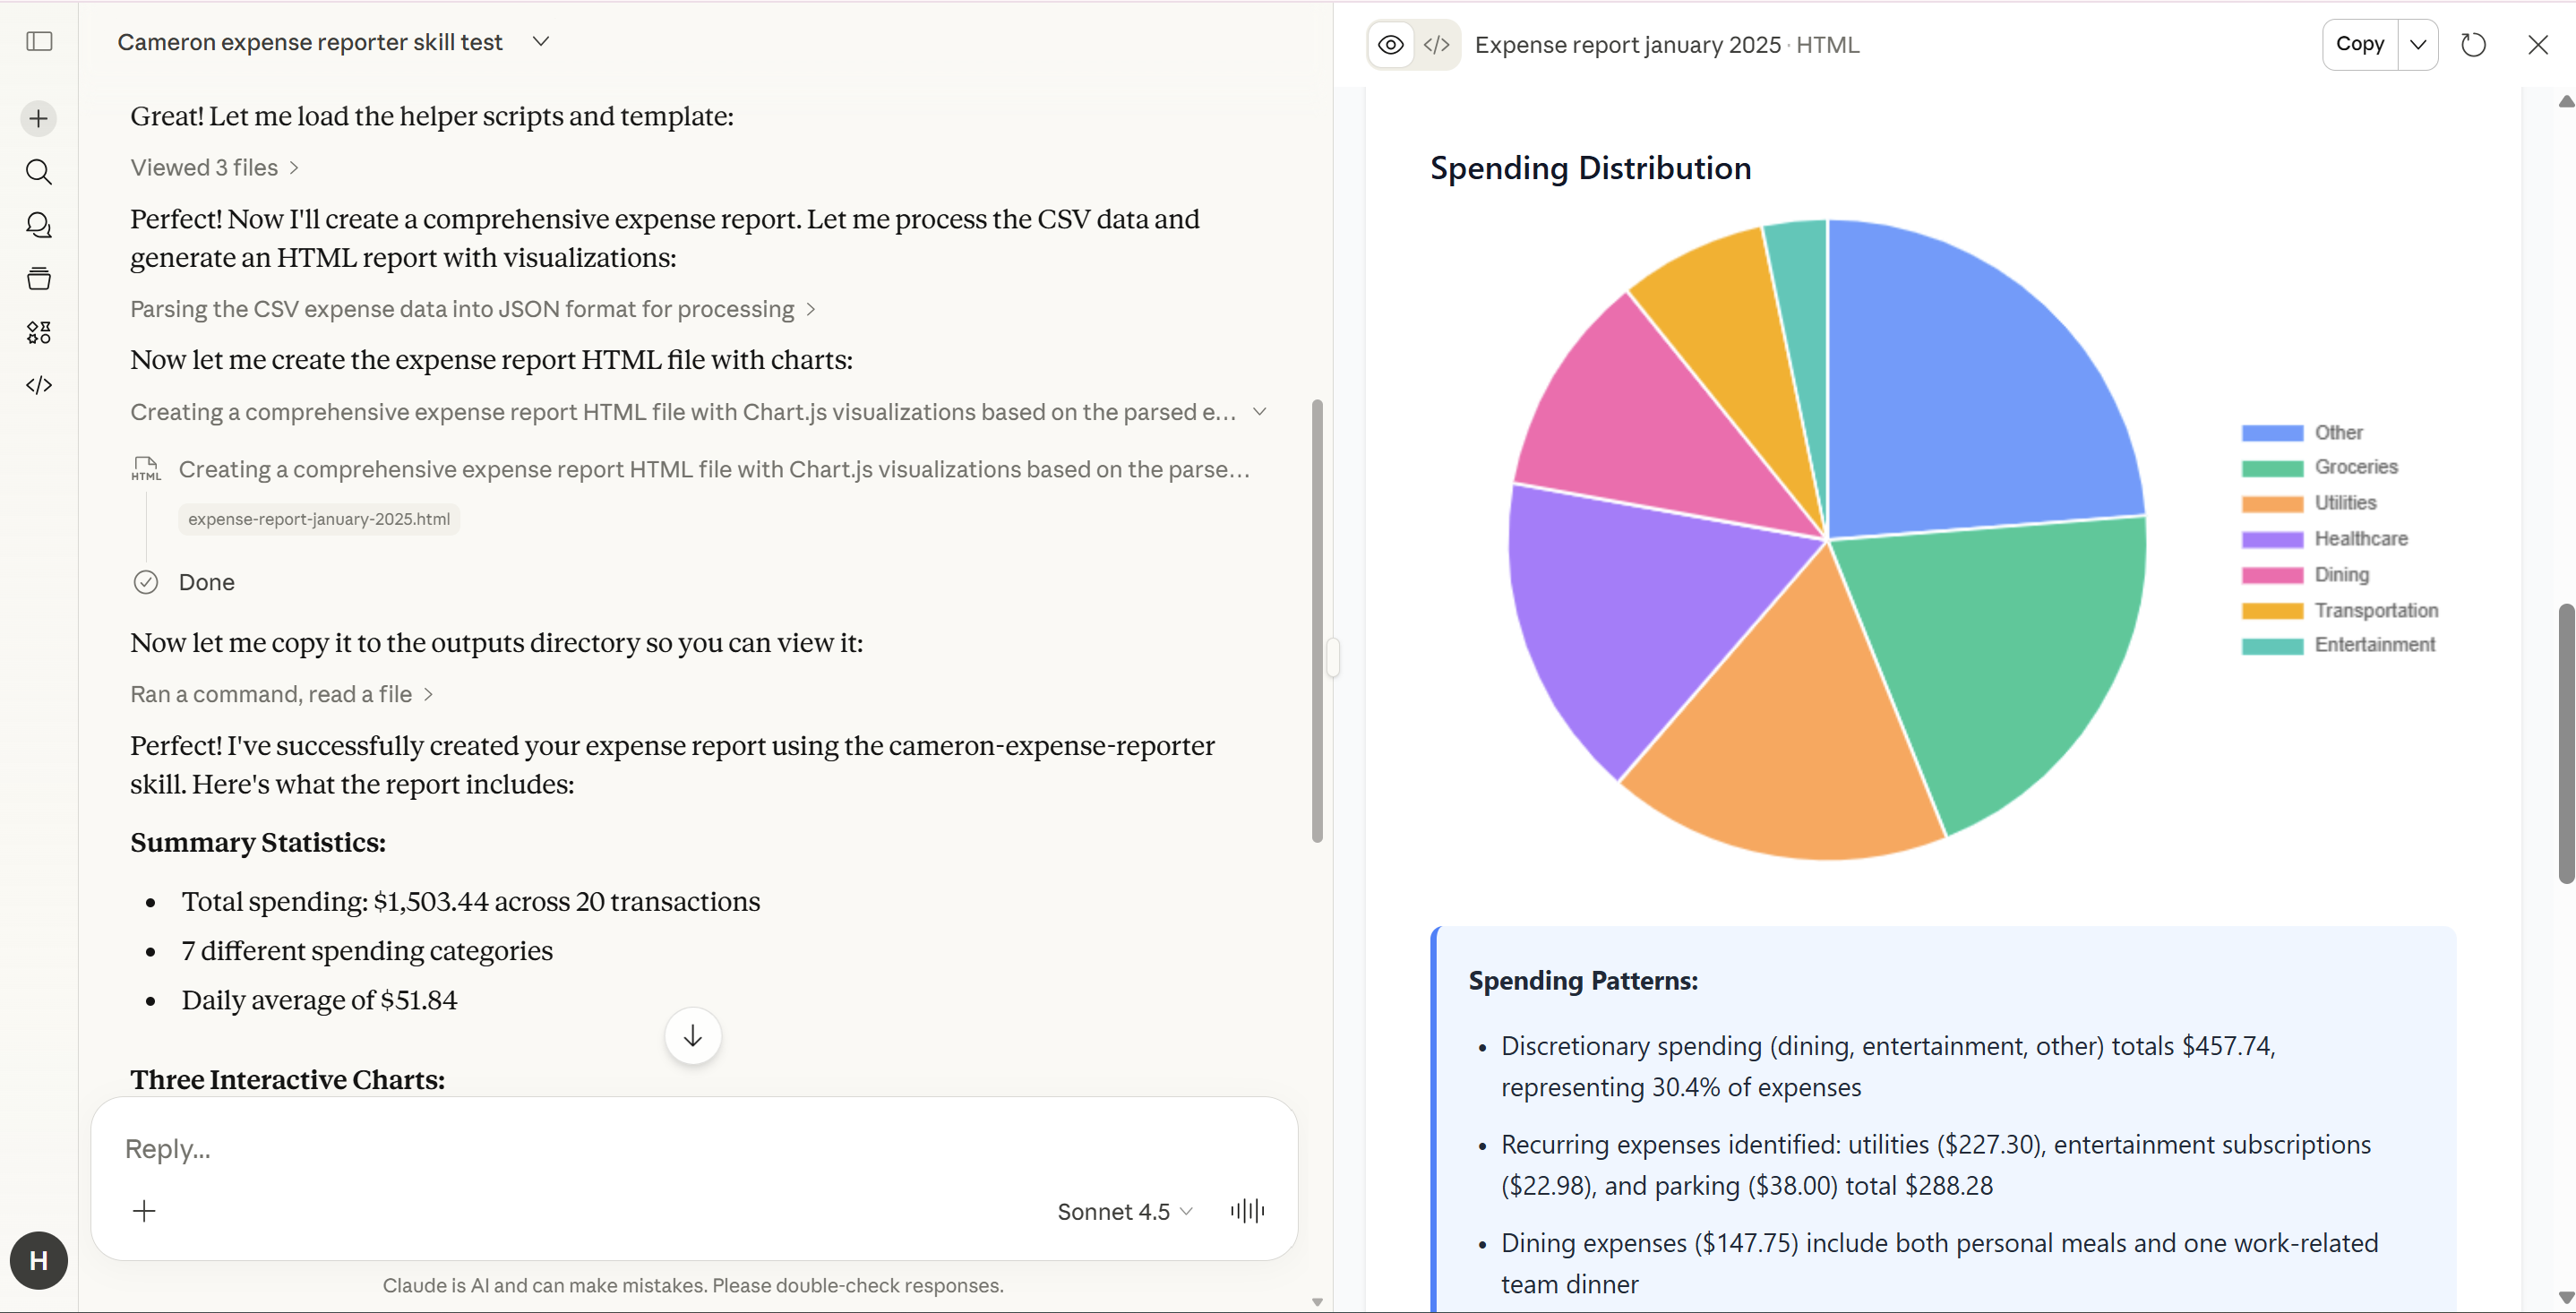
Expected behavior:
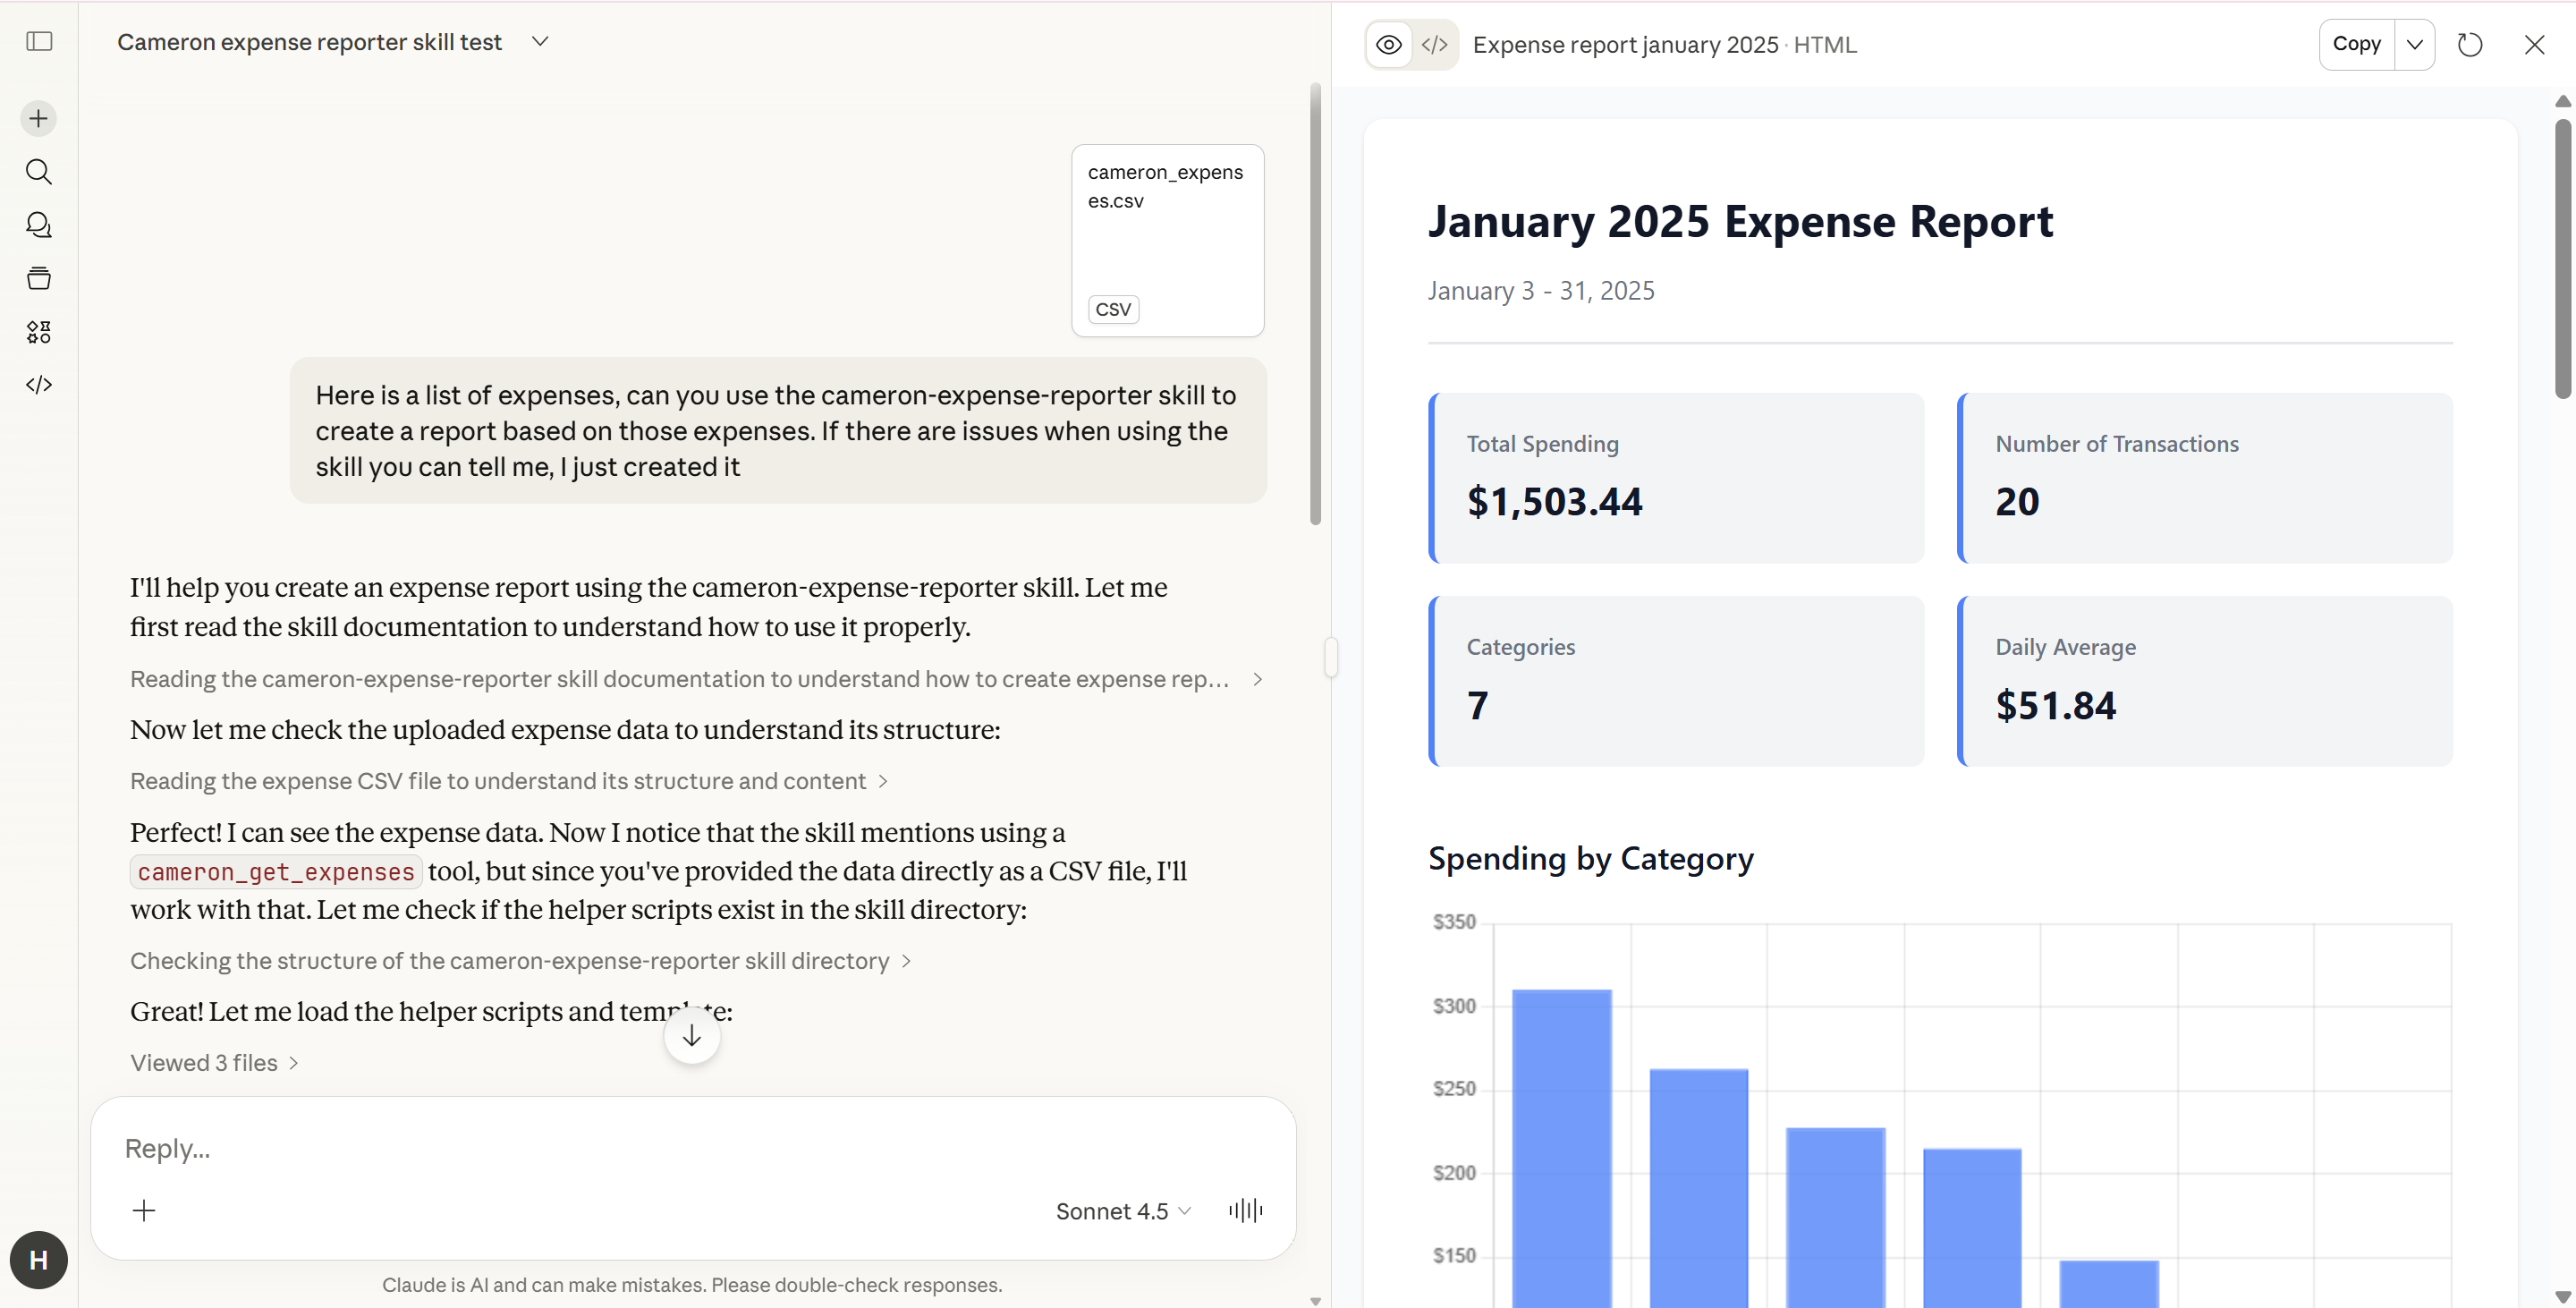
- Claude activates the cameron-expense-reporter skill
- Reads the CSV data
- Selects an appropriate chart type (bar chart for category comparison)
- Generates a Chart.js visualization with formatted data
- Provides written insights about spending patterns
- Outputs a complete HTML report
Best Practices
Now that you've built your first skill, here are some tips for creating effective skills:
Keep it focused. A skill should do one thing well. If your SKILL.md exceeds 500 lines, consider splitting into multiple skills or using supporting files.
Description keywords matter. The description field determines when the AI activates your skill. Include synonyms and common phrasings for your use case.
Use supporting files strategically. Complex skills benefit from:
- scripts/: Reusable code the AI can execute (JavaScript, Python, shell scripts)
- references/: Decision trees, documentation, examples (loaded on-demand)
- assets/: Templates, images, static files (used in output, not loaded into context)
Show function signatures, not full implementations. In SKILL.md, include:
// Good: Clear signature with purpose
function aggregateByCategory(expenses) { ... }

// Avoid: Inline implementation
// Keep actual logic in scripts/ directory
Balance brevity with completeness. The cameron-expense-reporter SKILL.md is ~290 lines:
- ~100 lines: Workflow steps
- ~100 lines: Best practices and common patterns
- ~90 lines: Quick references and troubleshooting
Test with real scenarios. Run your skill against actual tasks you face. Adjust the description and instructions based on what works.
Using the Skill Creator
We built the skill manually to understand each component, but you don't have to. Anthropic provides a skill-creator skill that can generate or iterate on skills for you, just describe what you want and let the AI handle the structure and formatting.
Beyond the Tutorial
The skill we built here is for learning purposes. Before shipping a skill to production or sharing it with other users, there are additional concerns to consider,especially if you're building custom agents.
Evaluation: Test your skill across diverse prompts to see how reliably the agent activates it, follows the workflow, and produces correct output. A single successful test isn't enough, edge cases and ambiguous requests will reveal gaps in your instructions.
Context management: Monitor how your agent's context grows when a skill is active. Loading full instructions plus reference files plus scripts can consume significant tokens. If your agent uses multiple skills in one session, context pressure becomes a real concern.
Infrastructure (custom agents): Coding tools like Cursor and Claude handle skill discovery and code execution out of the box. For custom agents, you may need to evaluate whether your MCP file server and sandbox are robust enough—particularly around file access permissions, execution timeouts, and error handling when scripts fail.
Conclusion
You've just created a sophisticated skill that transforms Cameron AI into a financial visualization expert. The SKILL.md file, along with its supporting scripts, reference guides, and templates—works across Cursor, Claude Code, and any custom agent with the right infrastructure.
This is the power of open standards: write once, use everywhere, whether in coding assistants or custom agents you build.
The skill you built demonstrates key patterns for production-ready agent skills:
- Progressive disclosure: Only load detailed references when needed
- Reusable scripts: Extract complex logic into executable functions
- Decision trees: Reference guides for consistent choices
- Professional output: Templates for polished deliverables
What workflow does your agent repeat most often? That's your next skill.
Resources
- Agent Skills Specification — Official open standard
- Example Skills — Official skill examples
- Vercel Skills — Registry of popular skills
Related Articles
- The Art of Agent Prompting: Anthropic's Playbook — Prompt design patterns behind Cameron AI
- Writing Tools for AI Agents — How to design effective tools like
cameron_get_expenses - Create Your First MCP Server in 5 Minutes — Add tool capabilities to complement your skills
AGENT BRIEFINGS
Stay measured as the field moves.
What actually matters for building and scaling AI agents in production — and what's just hype. Straight from the work, no filler.
Prefer LinkedIn? Read Agent Briefings there
$ subscribe agent-briefings
→ what works in production, what doesn't.
→ frameworks, MCP, evals, managed services.
→ signal over hype.